
PandasAI turns questions about tables into executable analysis code
November 15, 2026
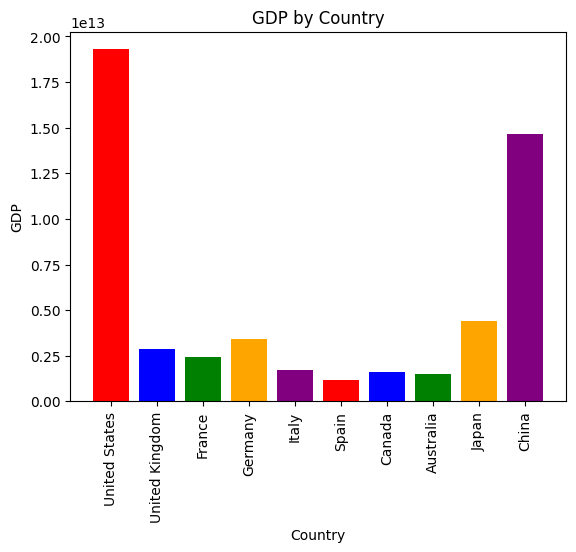
PandasAI connects everyday questions to Python analysis and charts. The library helps with data analysis, but needs clear checks for results, code execution and privacy.
What this is about
Anyone who regularly analyzes tables knows the small follow-up questions: How is revenue distributed across regions? Which group leads? And what does that look like in a chart? PandasAI addresses this part of the workflow. The Python library translates everyday questions into executable analysis code. It is a concrete tool for working with data, not a new language model.
This tool check dated November 15, 2026 examines the publicly documented library in the Sinaptik-AI repository. Its license identifies Sinaptik GmbH as the copyright holder. There is also a commercial offering on the product website. These should be kept separate: a Python environment you configure yourself is not the same as a managed dashboard service. This article is based on the current project sources; we did not conduct our own performance test.
What PandasAI actually does
The official repository provides a concrete starting point: install the library, connect a language model, load a CSV file and ask a question. The documented example configures an additional LiteLLM integration for this purpose. A question about average revenue by region is then passed to a chat method on the loaded dataset.
What happens behind the language interface is important. According to the security documentation, the language model generates Python code that PandasAI executes. An answer therefore does not consist solely of free-form text: the tool can run calculations on data and produce charts. The repository also demonstrates questions involving multiple tables, such as connecting an employee list with a salary table.
That makes PandasAI particularly relevant to people who already work with Python or have help setting it up. Natural-language interaction does not automatically remove their technical responsibilities. Tables need to be loaded, model access configured and the execution environment appropriately constrained. This distinction matters when a team wants to turn a quick prototype into something other users can access.
Why it matters
The practical benefit is a shorter path between a business question and an analysis that can be checked. Analysts can explore different groupings without rewriting the same setup code each time. Developers can integrate this kind of question interface into their own data workflow. For a simple, one-off sum, a spreadsheet will often remain the clearer option.
A vendor-independent USDSI overview likewise describes PandasAI as a tool for data exploration, visualization and analysis in the Python ecosystem. This provides additional context, not independent proof of accuracy. It does not establish specific time savings for an individual team.
Our editorial usefulness score is 8 out of 10: the use case is clear, the repository provides a concrete starting point, and separating analysis code from the model connection has practical relevance. Setup effort and the need for oversight count against it. The score assesses the documented usefulness of the approach, not a measured error rate.
In plain language
Think of PandasAI as someone sorting shopping receipts while you tell them: “Put all the groceries together and add up their amounts.” That person translates the request into individual steps. It saves you from spelling out every movement. But they could misclassify a restaurant receipt or overlook a refund. Clear definitions and a look at the sorted receipts therefore still matter.
A practical example
A fictional retailer tests the tool with an artificial CSV file containing 120 orders, three regions and columns for date, region, net revenue and cancellation. The team already knows the correct totals from a manually checked reference table. It first asks for net revenue by region, explicitly excluding canceled orders.
Next, it requests a bar chart of those values and asks which region has the highest revenue. The crucial test is not whether the chart looks professional. Do the totals match the reference? Were cancellations actually excluded? Does slightly different wording change the calculation?
For a second run, the team introduces a missing revenue value and a duplicate record. It checks whether the tool handles these cases sensibly or silently makes different assumptions. Only when both results and method are understandable is a larger trial worthwhile. This scenario is a suggested test, not a report of a completed customer trial.
Scope and limits
- Correct calculation requires correct meaning. A plausible result can rely on incorrect filters, inappropriate table joins or a misunderstood revenue definition. The answer replaces neither data cleaning nor expert review. Reports used for consequential decisions need traceable reference checks.
- Generated code creates a security boundary. The documentation recommends a Docker sandbox particularly for public-facing applications, untrusted inputs and sensitive data. It describes isolated, offline code execution and resource limits. This sandbox must be deliberately configured; a language interface alone is not sufficient protection. A sandbox is not a blanket proof of security either.
- Installed locally does not automatically mean entirely local. The documented model integration uses external API access. Before confidential analysis, teams need to check what information their particular configuration sends to the model provider. The offline code sandbox should not be confused with an entirely offline system. Model and infrastructure costs may also apply. According to the license, the core uses MIT Expat while enterprise areas have separate terms; the repository provides a contact route for commercial offerings rather than a dependable flat price.
The hero image shows a chart from the official repository, not a measurement from this check or economic statistics we have independently verified. Image source: Sinaptik GmbH/PandasAI; see the sources for the license. The sensible next step remains a small artificial dataset with known answers, not immediately connecting confidential business data.
SEO & GEO keywords
PandasAI, Sinaptik GmbH, Python, data analysis, CSV, natural language, data visualization, Docker sandbox, model integration, privacy
💡 In plain English
PandasAI turns questions about tables into Python analyses and charts. It requires a connected language model and a configured environment. Results and generated code need oversight.
Key Takeaways
- →PandasAI is a usable Python library for asking questions about data and creating charts.
- →The repository demonstrates CSV analysis and questions involving multiple tables.
- →Executing generated code requires a deliberately secured environment.
- →A local setup does not guarantee entirely local model processing.
- →The MIT Expat core must be distinguished from separately licensed enterprise areas.
FAQ
Do I need Python skills?
Python skills or technical support are useful for setting up the library examined here. Questions can then be expressed in everyday language.
Is PandasAI free?
The core uses MIT Expat, while enterprise areas have different terms. Model access, infrastructure or managed offerings can cost extra.
Does my data stay on my computer?
That depends on the model integration and configuration. An offline code sandbox does not mean model requests also remain local.
How should I test reliability?
Start with artificial data and known results. Also test missing values, duplicate rows and differently worded questions.